
In the previous blog, Mount OBI was introduced as well as AGOV. Both are metaphoric. The mountain represents how organizations can accumulate reporting assets.

AGOV’s efforts to reduce its fleet of OBI reports involved six phases. The prior blog (Introducing Mount OBI) discussed the context for these phases. This blog discusses preparing the environment.
- Understanding Mount OBI
- Death of Mount OBI [Optional blog, history and context of OBI]
- Tagging [Optional blog, inventorying an Organization’s Reporting Fleet]
- Prepare the Environment and Data [TECHNOLOGY, this Blog]
- Measuring Mount OBI: How Will the Objects be Evaluated? [PROCESS]
- Initiate Communications and Change Management [PEOPLE]
- Conduct Increasingly Focused Passes with sign off [PROCESS]
- Integrate into an overarching Data Governance Framework [GOVERNANCE]
- Note: the above blogs can be downloaded as a single PDF: AGOV Tackles Mount OBI.
Preparing the Environment (phase one) itself used the following xx steps:
- Counting the Challenges
- Many to Many to Many – Organic OBI-Chemistry
- OBI Extracts: Usage and the Collection
- Putting It All Together – Proto-Report Catalog
- Where Technology Stops and Process and People Begins
Counting the Challenges
AGOV’s OBI ‘fleet’ contains 200 distinct dashboards. These dashboards utilized about 2,500 pages (12.5 pages per dashboard). 6,000 or so distinct objects appeared one or more times on these pages.
I introduced this collection of ‘OBI-Objects’ as Mount OBI.

Some objects existed independently of a Dashboard because they can be run directly by advanced users although a dashboard is the unit most users interact with in OBI. These are in turn, found within a folder structure. A dashboard may also link to another dashboard.
Many to Many to Many – Organic OBI-Chemistry
In the following graphic, there is a cascade down to the report level. The reality is messier. The “Current Quarter Page” is found on the Finance and Operations dashboard. The Staff Turnover report is resident in Human Resources although some elements are found on the Current Quarter Page.
There is a drill down in the Human Resource dashboard to specific individuals who have left and their exit-interview comments; this report is restricted to a small group of staff in HR and some key executives. The Tax Department has created its own copy of the Staff Hires page to manage its unique requirements – however HR still ‘owns’ this Object.
In other words, discussions about ownership of Mt. OBI can be a challenge. Before this can happen, however, you need to know the exact topography and visitors to Mt. OBI.
OBI Extracts: Usage and the Collection
AGOV was able to query and extract two different data sets about its OBI environment. These were instrumental in the project and if not available through automated processes, this information needs to be derived manually (a daunting prospect).
Extract 1: Metadata
This was a ‘dump’ of the structure of the environment. Three files were generated labeled as Level 1, 2, and 3.
- Level 1: This was the primary file used for the review and described each permutation of dashboard, page, and ‘object’. An object being a report, prompt, link, etc.
- Level 2 and 3: Provided further details and returned which tables and columns were being used in the report. The Level 2 extract was useful in understanding direct usage….
Extract 2: Usage
For each OBI-Object, the date of when it was viewed and by whom was available in a usage report. This information was invaluable but had to be used with caution, noting these challenges:
- Duplicate Reports: The same report may have been copied in two or more locations and be otherwise equivalent.
- False Positive Usage: Because the usage was based at the Object level, if the Object exists on two or more pages, all pages will show the usage result.
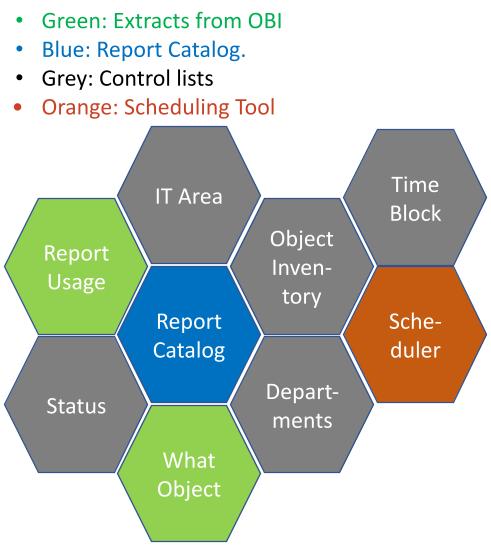
Putting It All Together – Proto-Report Catalog
AGOV created a ‘working proof of concept’ Proto-Report Catalog. The system linked SharePoint lists (used to collect updates to each of the Dashboards, Pages, and OBI-Objects) with updated extracts, inventory listings (to register OBI-Objects to be preserved, discussed in more detail in the subsequent blog), and a query engine to integrate these data sources.
The following diagram provides a conceptual data model for the catalog. Managing thousands of OBI data elements is challenging. The benefit of this model is that it can be technology agnostic. For example, it can also register Microsoft PowerBI or Tableau dashboards/reports as well.
Where Technology Stops and Process and People Begins
Now armed with a conceptual view of the OBI environment, data extracts about its content, and a tool to manage the information; it is time to evaluate the object for its quantitative and qualitative measures. This also takes us to the end of the ‘Technical’ aspects of Mount OBI. The next steps (and blogs) involve People and Process.
Before leaving the technology topic, however, what are your thoughts? Could your organization generate the extracts discussed above, if not, how would you proceed with your report review? Drop me a note and let me know your experiences.
Results, Notes and References
- The extracts from OBI discussed above are not native to the application. They were developed by one of AGOV’s staff members.
- The usage extract was dependent upon an audit function working properly in OBI.
- Ideally, similar extracts are available from other systems.
This blog series is about a public sector organization ‘AGOV’; a fictional mash up of recent experience, past knowledge, and research. I like to blog to remember, and a good memory device is to tell a story. A story always works better with sympathetic characters, such as AGOV.
