
The SAPAA received 30 years of site inspection data from the Alberta Government, converted from a Paradox database into an Excel format. This information included 2,973 inspections from 1988 to 2021. The data was subsequently transferred to a Microsoft Access database for further analysis and record-keeping.
Don’t you hate it? You brilliantly complete an activity and then move onto to the next thing. A few months/years later you are doing something, and it vaguely reminds you of that thing… you did… for someone… a long time ago…
- Aide-Mémoire – A Very Boring Way to Remember 30 Years of Data
- SAPAA Site Inspection Question Inventory
- The Data Concept
- Totally Tabular Dude!
- What Would Descartes Think?
- What Would Descartes Do? – Easy Peasy Data Conversion
- What Would Descartes Do? – More Challenging Data Conversion
- Pasting or Table Appending?
- Conclusions and Bigger Data Conversion
- Annex – Conversion Mapping
Aide-Mémoire – A Very Boring Way to Remember 30 Years of Data
One of the uses for this website is as an aide-mémoire for me. A recent data conversion is a good thing to remember as it was involved and used some pretty cool tricks that I might use again. This post will also be incredibly boring to all but those facing similar challenges. So, if you are ready for a snooze-fest, read on!
The Stewards of Alberta’s Protected Areas Association (SAPAA) recently received about 30-years of site inspection information from the Alberta Government. These were individual reports submitted by volunteers pertaining to a single protected area in the province. The data came from a Paradox database.
The output was a Microsoft Excel sheet which contain the 2,973 inspections from 1988 to 2021. Unfortunately, there is no way to verify the completeness of the data set so, on good faith, it is taken as complete, accurate, and comprehensive. Before looking into the past, however, let’s consider where the information was going.
SAPAA Site Inspection Question Inventory
One of SAPAA functions is to encourage inspections of protected areas. The inspection form is broken into 9 sections with 41 questions. Each question is assigned an ‘inventory number’ so that data is comparable over multiple years. For example, ‘Q11: Email Address’ captures the email address of the inspector and the same question number (Q11) is used year over year. See the Annex below of where the converted data would be migrated to.
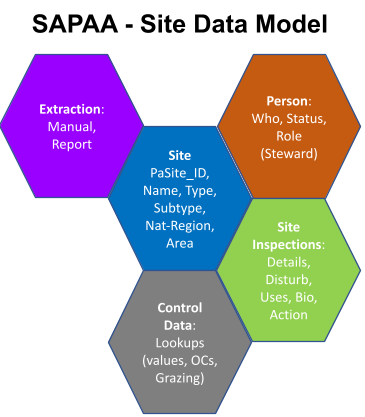
The Data Concept
The above graphic is the conceptual data model for SAPAA’s Site Inspection system. The data was converted into a Microsoft Access database. GROANNNnnnn, I hear from the techy readers, MS Access – BLECH!
I like MS Access as a data modeling tool. Its user interface is familiar to me and it solidly supports a third-general SQL environment. The fact that it comes free with my Office 365 subscription is a solid bonus as well! I would not consider it a production system for an organization, but it is a good tool to play with data.
One of the key design decisions of this database was to use a ‘record format’ to store inspection responses. Thus, each of the detailed inspection questions would have single record. The following table shows a subset of responses to one site inspection (2025-001). It should be noted that a response may either be a value (data field = ShortText) or a comment (data field = LongText).
InspectDetails Table
| Inspection | Observation | Obs_value | Obs_Comm |
|---|---|---|---|
| 2025-001 | Q31_Naturalness | 4=Great | |
| 2025-001 | Q41_Duration | 3 | |
| 2025-001 | Q42_WhyGo | Research, Work or Study Related | |
| 2025-001 | Q43_Details | flew to a long term monitoring plot, assessed for health and mortality, growth and regernation of whitebark pine. Whitebarks there are in terrible condition, about 95% infection and mortality there, little regeneration, decline trend | |
| 2025-001 | Q51_EaseVisit | None noted, we flew to our site | |
| 2025-001 | Q52_Biological | >95% rust infection on whitebark pines in assessment plot | |
| 2025-001 | Q53_INaturalist | Not Applicable |
And now back to the data to be converted. The first record of which was from April 5, 1988.
Totally Tabular Dude!
With apologies to the 1980’s slang of ‘Totally Tubular‘, the Excel sheet was in a tabular format and had the following characteristics:
- Rows: 2,973 X Columns: 66
- Columns were broken into 6 groupings:
- 6 demographic columns detailing the site, report id, dates, etc.
- 23 site disturbance columns covering things like tree cutting, ATVs, industrial development, etc.
- 17 ‘Site Uses’ columns for activities such as bird watching, camping, animal grazing, etc.
- 11 ‘Site Recommendation’ columns covering the need for fencing, signs, or clean ups.
- 6 ‘Site Remediation’ fields such has hanging new signs.
- 3 ‘Comment’ columns for biological notes or additional descriptions
- Cells could be categorized into the following XX formats based on the Row X Column intersection:
- 1. Boolean (YES-Convert): Yes/NULL field where Yes referred to the column description (e.g. for column Uses_Snowmobiling, YES = Snowmobiling).
- These columns were given the designation of ‘YES-Convert’ meaning that a YES value would be converted into the meaning of the column.
- 2. Short Text (Concatenate): Short text fields held brief notes from the inspector. These were typically < 100 characters in length and were often associated with ‘other’ fields.
- Individual comments were concatenated together with other columns mapping to the same SAPAA site inspection question.
- 3. Comment Fields: Longer text fields fields mapped to a single SAPAA site inspection comment question.
- 4. Fault Fields: Unfortunately, when the data was extracted from the original Paradox database there was a fault in the query in that it returned the ID value of a reference table rather than the value itself.
- For example, in the data file, the column ‘ReccommendedAction_Signs’ lists numbers 1 through 18.
- Each of these numeric values represents a reference to a subordinate table detailing what type of signs were needed, their placement, etc.
- This is an assumption that is yet to be confirmed by the Ministry.
- 1. Boolean (YES-Convert): Yes/NULL field where Yes referred to the column description (e.g. for column Uses_Snowmobiling, YES = Snowmobiling).
What Would Descartes Think?
2,973 rows and 66 columns would yield a Cartesian Product of 196,218 data records. Fortunately, the number was much smaller. The first 6 columns were normalized out into a header table for site inspections (e.g. one row for each person X Site X Visit). Many of the cells were empty (NULL value) allowing them to be excluded. The results were the following tables:
- Protected Areas Table: 317 records (60 more than what SAPAA normally recognizes).
- Inspection Header Table: 2,973 Records.
- Inspection Detail Table: 16,335 Records.
What Would Descartes Do? – Easy Peasy Data Conversion
Protected Area Table was populated from SAPAA sources. About 60 records needed to be added to accommodate sites included in the data source which were not normally part of SAPAA areas of interest.
Inspection Header Table was populated by selecting the DISTINCT site name and date information from the data set.
So far so good, the data conversion was straightforward…. and now for the Challenging Bits.
What Would Descartes Do? – More Challenging Data Conversion
For each row, 22 potential detail database entries could be generated. These rows were mapped into one or more of the 41 SAPAA Site inspection questions. A single result was returned for each question even if this required concatenating one or more Data fields. Not all the SAPAA questions were answered, only those for which a mapping was available.
A DISTINCT() Solution to a Row Problem
One of the challenges in converting tabular to record is that all records must pertain to a single row. Once the first 22 values are converted then the next row must be selected and 22 addition values generated.
Spreadsheets are great for referencing. Copy a formula down and it updates itself relative to its new placement. Adding a ‘$’ sign to one or more of the column/row elements freezes the formula. This is a powerful feature of a spreadsheet and a challenge for the data conversion.
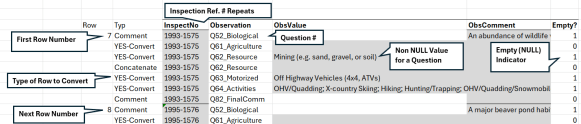
The above graphic hides some of the 22 intervening rows used to convert one row of tabular data. The first row to be converted (row 7) is incremented by one using a simple Excel formula to convert the next row of data (row 8). The 22 conversion rows are then copied 2693 times, one for each tabular row to be converted.
Using native Excel functionality, copying and pasting the formulas would skip 21 rows. Fortunately, there is a DISTINCT() solution.
=INDIRECT(“AV”&C2982) Returns the column ‘AV’ combined with the value in cell C2982, ‘7’ or the cell reference ‘AV7’. The 22 conversion rows can all refer to the 7th data row. After 22 iterations, the formula would then read: =INDIRECT(“AV”&C2983) or the next Tabular row down.
Other formulas used to manage the data included:
- IF() and ISBLANK() to evaluate whether a cell contains a value or not:
- IF(ISBLANK(INDIRECT(“AV”&C2982)),””,INDIRECT(“AV”&C2982))
- “&”[TEXT]”& allowed for the concatenation of values.
- IF(ISBLANK(INDIRECT(“K”&C2982)),””,K$3&”; “)&IF(INDIRECT(“R”&C2982)=””,””,R$3&”; “)
- A NULL/NOT NULL column was used to evaluate whether a resulting record had result returned or not.
- If the a particular site inspection row had any type of value (e.g. NOT NULL), then the value of ‘1’ was returned for either or both of the Value and Comment columns.
- If there were no results for a particular question (e.g. NULL), then a ‘0’ value was returned.
- If both the Value and Comment fields equaled ‘0’, then the record was excluded from the data conversion.
- =IF(G2982=””,0,1)+IF(H2982=””,0,1)
Pasting or Table Appending?
If I have one complaint about MS Access is that it is very finicky in appending new records where the table is normalized. With only 16,335 records to load, I found it best to paste them into the table and allow the user interface to append the records. Not realistic with a million records but a work around for finicky-ness.
Conclusions and Bigger Data Conversion
This data set was very small and so the somewhat manual process described above worked fairly well. With a larger data set and technical team I would have probably used one of these tools:
- Programmatic. Write a Visual Basic script to crawl the spreadsheet and write the columns into a record.
- Data Conversion Software. Tools such as Ode to ODI – Documenting the Plumbing could either programatically convert the data.
- AI Magic. Likely an AI tool could have been trained to generate the output.
Given that all of the above require technical expertise and access to software, the MS Excel kludge described above worked just fine!
Annex – Conversion Mapping
| Legacy Column | 2025 SI Section | Choice Type | Choice Value |
| PaSite_ID | PaSite_ID | Header | |
| NAME | Site Name (Q22) | Header | |
| TYPE | Header | ||
| Report_OID | InspectNo | Header | |
| Report_record_date | DateInspect | Header | |
| Dis_Veg/Animals_TreeCutting | Q62_Resource | YES-Convert | Tree Cutting |
| Dis_Veg/Animals_BarkStripping | Q62_Resource | YES-Convert | Bark Stripping |
| Disturbances_Veg/Animals_Collecting | Q62_Resource | YES-Convert | Collecting / Trapping |
| Disturbances_Veg/Animals_Fire | Q65_Gathering | YES-Convert | Camping (lean-to’s, fire rings, etc.) |
| Disturbances_Veg/Animals_Poaching | Q62_Resource | YES-Convert | Hunting (blinds, dressing site) |
| Disturbances_Veg/Animals_Other | Q67_NotThere Comm | Concatenate | |
| Disturbances_SoilRemoval_Sand | Q62_Resource | YES-Convert | Mining (e.g. sand, gravel, or soil) |
| Disturbances_SoilRemoval_Gravel | Q62_Resource | YES-Convert | Mining (e.g. sand, gravel, or soil) |
| Disturbances_SoilRemoval_Peat | Q62_Resource | Concatenate | Mining (e.g. sand, gravel, or soil) |
| Disturbances_SoilRemoval_Other | Q67_NotThere Comm | Concatenate | |
| Disturbances_Vandalism_Garbage | Q65_Gathering | YES-Convert | Garbage dumping/Vandalism |
| Disturbances_Vandalism_Signs | Q65_Gathering | YES-Convert | Garbage dumping/Vandalism |
| Disturbances_Vandalism_CutFence | Q66_Infrastructure | YES-Convert | Cut fences, unauthorized entries |
| Disturbances_Vandalism_Other | Q65_Gathering | Concatenate | |
| Disturbances_NewTrails/ ClearedLines_ ATV | Q63_Motorized | YES-Convert | Off Highway Vehicles (4×4, ATVs) |
| Disturbances_NewTrails/ ClearedLines_ A4wd | Q63_Motorized | YES-Convert | Off Highway Vehicles (4×4, ATVs) |
| Dist_NewTrails/ClearedLines_Hike/ Equestrian | Q64_Activities | YES-Convert | Trail Riding (horse) |
| Dist_NewTrails/ClearedLines_Cutlines/ Seismic | Q66_Infrastructure | YES-Convert | Roads / Cut lines |
| Dist_NewTrails/ClearedLines_ Fencelines | Q66_Infrastructure | YES-Convert | ClearedLines_Fencelines |
| Dist_NewTrails/ClearedLines_Pipelines/ Wellsites | Q66_Infrastructure | YES-Convert | Pipelines |
| Dist_NewTrails/ClearedLines_ Powerlines | Q66_Infrastructure | YES-Convert | Power lines |
| Disturbances_NewTrails/ClearedLines_ Other | Q66_Infrastructure | Concatenate | |
| Disturbances_Comments | Q67_NotThere Comm | Comment | |
| Uses_ATV | Q64_Activities | YES-Convert | OHV/Quadding |
| Uses_BerryPicking | Q64_Activities | YES-Convert | Berry Picking |
| Uses_BirdWatching | Q64_Activities | YES-Convert | Birding |
| Uses_Camping | Q65_Gathering | YES-Convert | Camping |
| Uses_Xcountryskiing | Q64_Activities | YES-Convert | X-country Skiing |
| Uses_Fishing | Q64_Activities | YES-Convert | Fishing |
| Uses_4wd | Q64_Activities | YES-Convert | OHV/Quadding |
| Uses_Hiking | Q64_Activities | YES-Convert | Hiking |
| Uses_Hunting | Q64_Activities | YES-Convert | Hunting/Trapping |
| Uses_Picnicking | Q64_Activities | YES-Convert | Picnicking |
| Uses_Snowmobiling | Q64_Activities | YES-Convert | OHV/Quadding/Snowmobile |
| Uses_TrailRiding | Q64_Activities | YES-Convert | Equestrian |
| Uses_Other | Q64_Activities | Concatenate | |
| Uses_CattleGrazing | Q61_Agriculture | YES-Convert | Domestic Animal Grazing |
| Uses_HorseGrazing | Q61_Agriculture | YES-Convert | Domestic Animal Grazing |
| Uses_Other_ | Q64_Activities | Concatenate | |
| Uses_Comments | Q64_Activities | Comment | |
| BiologicalNotes_Comments | Q52_Biological | Comment | |
| ReccommendedAction_Fencing | Q71_Remediate | YES-Convert | Fencing |
| ReccommendedAction_Cleanup | Q71_Remediate | YES-Convert | Cleanup |
| ReccommendedAction_Revegetation | Q71_Remediate | YES-Convert | Re-vegetation |
| ReccommendedAction_Other | Q71_Remediate | Concatenate | |
| ReccommendedAction_Signs | Q71_Remediate | Fault | Signage |
| ReccommendedAction_Posts | Q71_Remediate | Fault | Signage/Sign Posts |
| ReccommendedAction_FenceWire | Q71_Remediate | Fault | Fencing |
| ReccommendedAction_ InspectionReports | Q71_Remediate | YES-Convert | |
| ReccommendedAction_Film | Q71_Remediate | Fault | |
| ReccommendedAction_Maps | Q71_Remediate | Fault | Signage |
| ReccommendedAction_Other_ | Q71_Remediate | Concatenate | |
| ProjectCompleted_Signs | Q72_UDone | YES-Convert | Signage/Sign Posts |
| ProjectCompleted_Fencing | Q72_UDone | YES-Convert | Fencing |
| ProjectCompleted_Cleanup | Q72_UDone | YES-Convert | Cleanup (e.g. Trash removal) |
| ProjectCompleted_WeedControl | Q72_UDone | YES-Convert | Weed Control |
| ProjectCompleted_Other | Q72_UDone | Concatenate | |
| ProjectCompleted_Comments | Q74_2BDone Comm | Comment | |
| Summary | Q82_FinalComm | Fault | |
| Summary_Comments | Q82_FinalComm | Comment | |
| Received_date | Timestamp | Header |
