
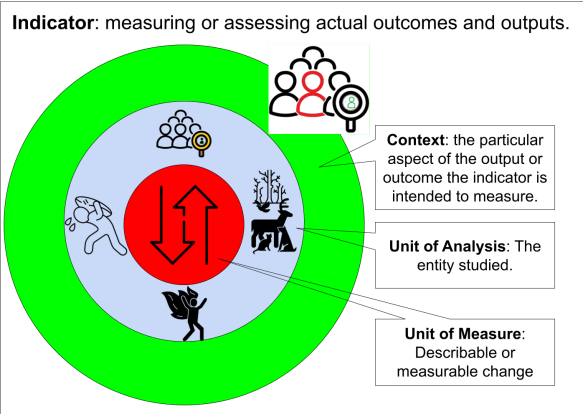
The construction of a good indicator involves three elements: the indicator itself, unit of measure, and unit of analysis. It requires careful consideration of whether to use qualitative or quantitative data, selecting measures based on the result, and ensuring stakeholder involvement. The ideal indicator balances clarity, relevance, and resource demands.
The previous post, What Makes for a Good Indicator, highlighted how do you know you have a good measure. This post answers the question, how do you construct a good indicator? Not too much original content here as this territory has been covered by the RBM literature with one exception. Most RBM content give a passing reference to needing to change an indicator. This has been added as the difficultly should not be underestimated.
Construction of an Indicator
The construction of an Indicator has three, nested, elements: the Unit of Measure, the Unit of Analysis, and the Context of the Indicator.
Unit of Measure

The describable or measurable change that is derived from an initiative’s outputs or lower-level outcomes.
It is essential for tracking progress and ensuring that the desired changes are being achieved.
Units of measure can be qualitative or quantitative and are crucial for setting realistic targets and assessing performance.
Unit of Analysis

The entity being studied or measured. It may be individuals, groups, organizations, or other entities.
Determines the level at which data is collected and interpreted.
Understanding the unit of analysis is crucial for ensuring that the research or management approach is focused on achieving the desired outcomes and results.
The Context of the Analysis
The context is the set of circumstances that specify the particular aspect of the output or outcome that the indicator is intended to measure.
Types of Measures
Measures are broadly broken into Quantitative and Qualitative which are traditionally defined as follows:
Quantitative Data
- Involves measurable numerical information.
- Each involves a distinct value which can be traced back to the source data.
- Two different analysts would come to similar conclusions based the same data.
Qualitative Data
- Descriptive data capturing phenomena like language, feelings, etc.
- There may be some variation between two analysts in reviewing the data.
- This is the role of the peer review process in scientific paper publishing.

Selecting an Indicator
1. Identify & Understand Result
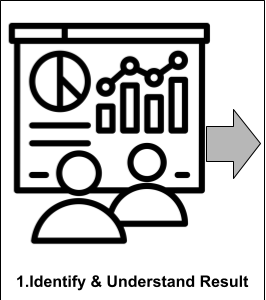
- Determines the scope of the indicator set, helps to keep the project focused.
- Attention should also be given at an early stage to the processes that will be used in the development of the indicators.
- The most important question is what exactly is the nature of the result and how best to measure it according to which audience.
- Other important questions to consider:
- Who will be responsible for the final selection and publication of the indicators?
- How will key stakeholders be involved?
- Will an expert group be established to provide specialist advice?
- Will public consultation be undertaken?
- How will the indicators be sustained and funded over time?
- How will changes to the result or the indicator be managed?
2. Clarify how to measure the result

- Now that you know the result, how best to measure it?
- Does it lend itself to quantifiable measures or is it more subjective requires a qualitative measure?
- What does a member of each of the 5-Audiences need to know to understand the state of the result?
3. Identify possible Measures
This is where the activity moves from the abstract to the practical

- What are the different methods to measure the results?
- One method is to start with the perfect measure, whether it exists or not, and work backwards to what is practical.
- Rate and evaluate the different measures according to the Data Collection Considerations (Valid, Reliable, etc..).
- Identify who owns both the Data and the Process to collect the data.
- Is this entity reliable and can they continue to provide the measure?
- Is an index measure required given the need for multiple measures and the incongruence between the measures?
3a. A Change Management Interlude
Selecting a measure is hard. Discarding it and replacing it with another is harder still. Worse still is sticking with a ‘Zombie-Indicator’ only because change seems too challenging. Thus the need to identify a transparent and reasonable change process in advance.
- Why would a measure need to be changed, what are the conditions necessitating it?
- Who is involved in the decision, how and when is the decision made?
- What are the triggers to identify when the measure is no longer working or needs to be improved?
- How will past measures be managed, for example, is the new measure on a go-forward basis or does past reporting need to be restated?
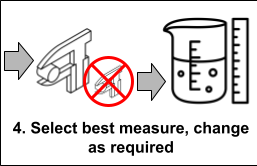
4. Select best measure, change as required
Select the measure that is the best compromise of the known characteristics (see post: What Makes for a Good Indicator).
- Document and explain how it describes the state of the result.
- Using the change process created previously and update the result if necessary.
- Communicate the change to the relevant 5-Audiences.
Conclusion
As with everything involved with RBM, these are pretty graphics that hide the complexities involved. In the end, what is the perfect indicator? It is the one that is the best compromise of telling the result story, understandable, useful to decision maker, relevant, reliable, and is affordable.
This may seem to be evading the question, but the reality is that there is no perfect measure. This is not an excuse to avoid work; it is a challenge to the public sector to find the best compromise between competing demands for resources.
Notes and References
There are many excellent resources available that discuss the indicator creation process. Most of them are variations or very close to Global Affairs Canada’s excellent guide on RBM.
- Global Affairs Canada. “Results-Based Management for International Assistance Programming at Global Affairs Canada: A How-to Guide.” Government of Canada, 2016.
