
If you ever worked in private practice or consulting, you know the joys of tracking time. Even if you never had such employment, knowing where the minutes went can help you better plan and may help non-profits.
Often granting organizations include volunteer hours as in-kind contributions. The time board members or senior volunteers spend supporting these organizations is frequently lost. A simple time tracking tool can capture these moments. This tool is part of the the 2024 Birkie or IPOOG Business Model.

- Where Has the Time Gone?
- Time Tracking in Context
- Download the File (soon)
- Time for an Overview
- Discipline and The 15-Minute Increment
- Colour Cues in the Spreadsheet
- People and Billing – Needed?
- Where to from Here?
- References and Further Reading
Where Has the Time Gone?
Over the past few months, I have spent a lot of time editing videos, preparing documents, and working on various retirement projects. Exactly, how much time… not sure… and that is the problem. I was not using a systematic method to track where my time went and thus better plan future endeavours.
Starting August 1, I am going to fix this by following my own advice. I plan to use this time tracking tool until at least next January to better understand where I spent the precious moments I have here on earth. Beyond being accused of being obsessive compulsive, I am doing it to ‘eat my own dog food’ [1].
Time Tracking in Context
The Time Tracking tool is part of a larger file known as the QDIRF which in turn is part of the IPOOG methodology. The QDIRF includes a project task list, a Question-Decision-Issue-Risk-Fault/Fix log (and its name), a weekly plan, control data, and the time tracking tool.
The time tracking tool uses the same control or meta data as the other sheets plus some good old fashion spreadsheet functionality. These manual kludges are described in the following graphic (remember, full automation costs money) [2].
Download the File (soon)
You can (soon) download the file in both a Google Sheet and Microsoft Excel format. Once you do so, you are on your own to update, etc.
>>>> Download IPOOG Tracking Tool <<<<
(Link is pending, check back soon)
Time for an Overview
The version in the graphics is my personal 2024-time tracking tool that I am committing to use for the rest of this year. Another blog will discuss the project and human resource tools part of the file in more detail. Suffice it to say, you need to set up a project plan to be able to enter time. To set up this plan, you need to populate the meta data entering WHO is doing WHAT by WHEN.
Discipline and The 15-Minute Increment
Once this one time set up is done, enter your time. My suggestion is to use 15-minute increments. It is a reasonable compromise between precision and not making time tracking onerous. I know some professionals bill at smaller units of time, but they have a financial incentive to do so.
Tracking time is the least favourite activity of EVERYONE. Encouraging volunteers to do so even more so. As a result, for non-profits, having a shared spreadsheet may encourage contributions. Include a dollar value so volunteers can see how the 15-minutes reading emails contributed $5 or so to the organization’s grant reporting.
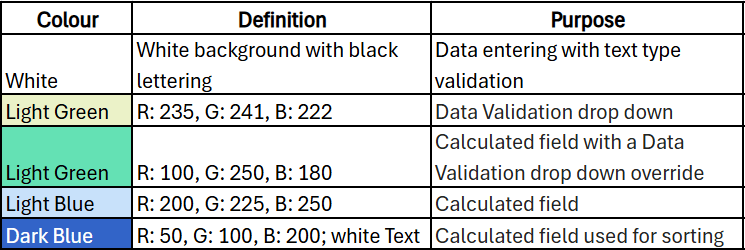
Colour Cues in the Spreadsheet
To improve volunteer contributions, colour coding is used consistently throughout the spreadsheet. Light green is a drop down; darker green a calculated field the user can override with a drop down. White is ‘fill your boots’ although there may be some data validation (e.g. must be a date). Blue is a calculated field which you leave alone. Dark blue is a calculated field which is also a sort field. For time tracking, the sort field is largest to smallest based on: DATE + NAME + BILLING.
People and Billing – Needed?
The sort field contains two fields that are critical or unnecessary. For me, it makes no sense, for the moment, to have the NAME field. If I am the only one using it, why include it? Keeping it in is easier then removing it and my son helps me with some of the projects so he may share the file.
Billing is used because it is hard to drop the consultant mind set. It is very useful for non-profits to know where you spend your time. For example, the following graphic shows where staff time went for the Canadian Birkebeiner Society (with name changes). This type of information can be gold in recruiting new volunteers or deciding where to automate.

Where to from Here?
As mentioned, I am using the tool for the balance of 2024. Initiating the tool, I discovered that I worked on at least 42 distinct things in the first 7 months of 2024. Some would be an hour or two. Others, such as creating videos, may have inched north of 100-hours of effort. How much more, not sure but starting August 1, I will now know!
| Frank’s Interests | # of Tasks |
|---|---|
| 0100-Birkie | 3 |
| 1000-SAPAA | 17 |
| 2100-CPA Amb. | 8 |
| 5000-Write | 2 |
| 6000-YEGVille | 12 |
| Total Things Done to Date (August, 2024) | 42 |
References and Further Reading
- This unusual idiom has a murky past… as murky as what exactly is in dog food! Eating your own dog food – Wikipedia.
- Kludge – Wikipedia

Pingback: 2024 Birkie Business Model | Organizational Biology
Pingback: Three Months of IPOOG’ing | Organizational Biology
Pingback: It’s IPOOG TIme! | Organizational Biology
Pingback: Nov 21, 2024 – First IPOOG Session | Organizational Biology
Pingback: Thank You for IPOOGing | Organizational Biology
Pingback: I – IPOOG’d | Organizational Biology
Pingback: A Mid-Year IPOOG | Organizational Biology
Pingback: Death Marches, Rope Burn, Video Editing, and Other Fun | Organizational Biology